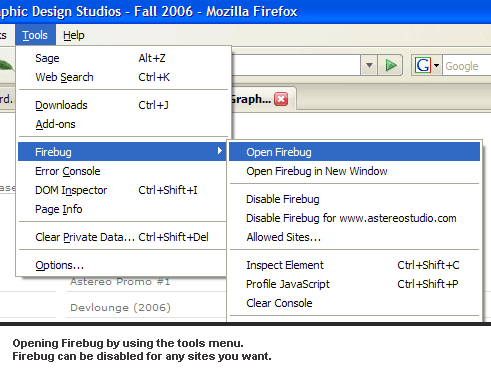
Firebug is a new Firefox extension which gives developers a slew of amazing source viewing and editing power, but will rippers use the benefits of the program for their own monetary advantage? We discuss the benefits and possible downfalls of this excellent plugin. Is it a dream and nightmare for developers all in one?
What Is Firebug?
Firebug is a new Firefox extension that is still in beta, but presents a host of excellent features and time-savers for debugging code. Firebug is built by Parakey Inc, which if you haven’t heard is the source of some web based magic being built by a few members of the Firefox Team and friends.
The Features
The features of Firebug undoubtedly takes your normal “View Source” and “Dom Inspector” and ups the ante, allowing you to do a whole lot more simply by calling up the tool on any web page.
The features, according to the Firebug site are as follows:
- Inspect and Edit Html
- Tweak CSS to perfection
- Visualize your css
- Monitor Network Activity
- Debug and Profile Javascript
- Quickly Find Errors
- Explore the DOM
- Execute Javascript on the fly
- Logging for Javascript
Quite a hefty list of features for an extension with a download size under 300kb. Let’s dig a little deeper.
Looking Under the Hood
Firebug is mostly all about helping the developer spot problems and get them fixed in a live environment, right from the browser window. The features of Firebug do so much to aid, it’s definitely an essential for every developer.
The first tab you are presented with when bringing up FB is the HTML Inspector.

The HTML inspector lets you expand every element of a design, eventually exposing the entire markup of the site from top to bottom. You can edit the html directly in Firebug. At the same time you have an element selected, for example a div called “main”, you see the corresponding css for that element right to the right of the source window. A very convenient way of viewing and editing code side and css side by side. Firebug allows shows you a visual representation of the element you may be hovering over, based on css. In the screenshot below, we happened to be hovering over the navigation div.

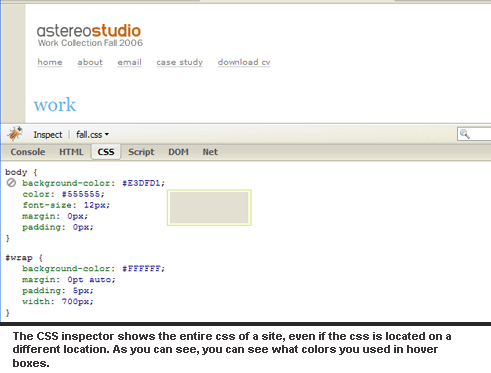
The next tab you’ll find is the CSS inspector. The CSS inspector will pull a sites entire stylesheet no matter where it may be located. Good for developers, but bad for those who want their original designs kept safe. While of course, it’s not like any old “View Source” wouldn’t simple give away the location of the stylesheet, but that fact that it’s right there in front of you makes it even easy for beginners to have a look at your code.

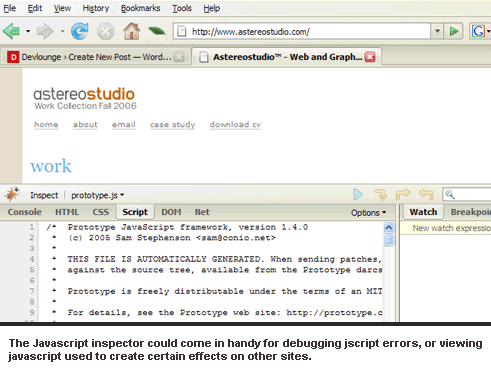
Firebug also contains a script inspector, which, even though I don’t write Javascript, I believe it would be extremely useful in debugging problems with Javascript code. There is also the usual DOM inspector.

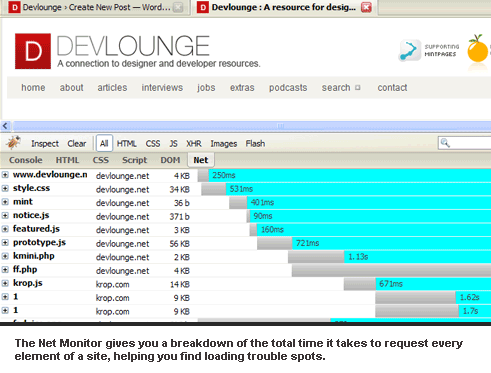
Finally, there is a nifty features which allows you to break down the total requests a site makes and determine exactly which element(s) are taking the most time to load. This can be extremely helpful when you find your site taking ages too long to load, but you’re unsure what query could be causing the slow pace. The Network Monitor can help you determine where and what the problem(s) is/are.


