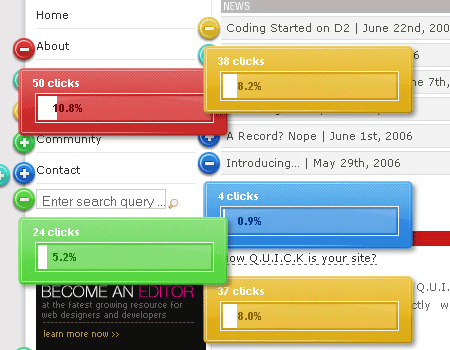
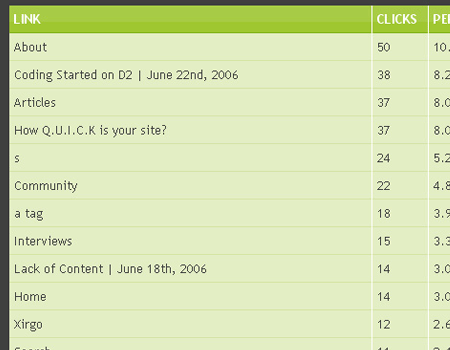
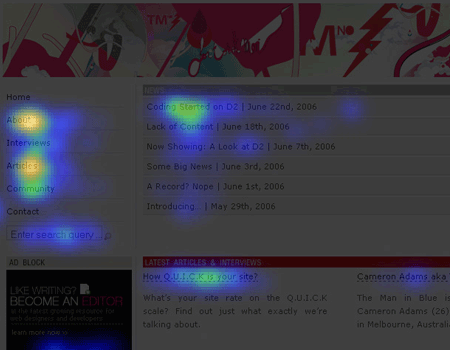
Reinvigorate is an up-and-coming hosted statistic tracker for websites, which mashes various elements of Google Analytics and Mint. While currently in private beta, I’m here to preview the service as it currently stands right now.

Reinvigorate – A new stats option
Statistical analysis always plays a key role in any kind of business. You always want to know whose buying what, where they’re buying it, what’s doing good and what’s struggling – so you can improve your products or services and tailor them better to your target audience. The same concept can be applied to sites, even if you’re not selling something.
As designers and developers, as well as writers (in the case of Devlounge, blogs, etc), there are key bits of information you want to know; what screen resolution are most of my visitors at, where (location-wise) are most of my visitors from, what browsers are the most popular, and what articles and pages are doing the best in terms of visits. These are all key stats to gather, because with them, you can have a better understanding of your visitors and begin making changes to better accommodate them, for example, designing sites to be larger if most of your audience is at a much higher screen resolution.
With so many things to track, how do you do it? There are many different tracking scripts and services out there – some self hosted, and some web based. Reinvigorate hopes to be an alternative to those using either Mint or Google Analytics. Let’s see how it stacks up.
A look into Reinvigorate
Reinvigorate takes on a look of it’s own, but does it using a feature combination of both Mint and Google Analytics. Let’s break down some of the main features of RI.
Once you get yourself situated with RI and install a line of tracking code into your sites pages you want to track, RI will begin tracking your data. In my beta access to RI I’m tracking hits on my portfolio (which is only one page) and my Testing Ground blog where I do a lot of playing around with new WordPress themes and client work.
After a login you’re presented with a dashboard showing an overview of the sites you are currently tracking. For the beta, there’s no limit on the amount of sites you can track. It shows you the status of each site (tracking in progress or waiting or tracking code to be installed). You can then remove a site, add another one, or view reports for a specific site.
So let’s just right into to the first tab of RI, which is the Overview.

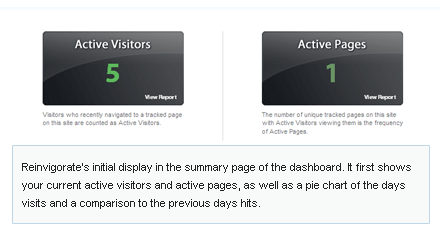
Each tab has multiple sub tabs, and a click on overview will bring you to the “Overview>Summary” tab. From here, you have a brief and simple look at your site. You can see at a glance the current active visitors on your site and the active pages, as well as a summary of your visitors and a comparison to the visits of the day before.
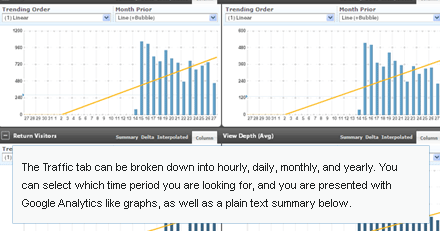
The next tab I’ll focus on is Traffic. Traffic is broken down into sub tabs for hourly, daily, monthly, and yearly. Each tab displays 4 graphs: page views, visitors, returning visitors, and view depth. There are a couple different ways to view the graphs, but the default is a column (bar) graph. It also shows a trend line, which you can also fine tune for each graph.
Below the graph’s there is a standard text summary of each hour/day/month/year (depending on what tab your currently active on), the time, number of visits, returning visitors, and view depth.
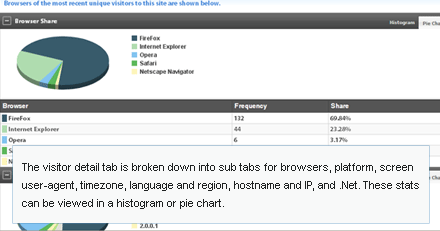
Next there is the Visitor Detail. This is essentially where all the tidbits of information gathered from each visitor come into play. Everything from browser and version number to timezone and language. Each page contains pie graphs to go along with the gathered data.
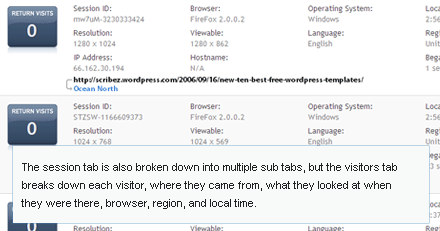
The last tab we’ll take a good look at is the session tab. The visitors sub tab takes a good look at your last 50 visitors, and includes various information about them, including resolution, IP address, browser, operating system, language, region, and local time, as well as where they came from and where they went. It also shows how many return visits (if any) that particular visitor has had.
Other tabs we won’t get that in depth about are Referrers and Site and Path (For Popular pages, exit pages, etc).
If you’re interested in seeing some larger screenshots, click the thumbnails below (they will take you off the page, so either open in a new tab or have a look when you finish reading the article).
Advantages over Mint
RI does have some advantages over Mint, besides that fact that you don’t have to host the service yourself. Mint comes with a price tag of $30, while, at least for the moment, Reinvigorate is free. While I’m sure that the public release will not be at least entirely free (most likely there will be different levels and more advanced stats for a higher price, while limited stats will most likely be free.) If RI is fully available without restrictions for free, it does offer about the same features as Mint (excluding what peppers can add to Mint).
What it’s missing
Right now, something that stands out in my mind that RI is missing is the ability to export stats data to a text file and/or spreadsheet. Mint also lacks this ability, and it’s a must if you wish to present your stats and keep a hard copy of your visits away from the script / service itself. I’m also not too keen on the over anti-aliasing fonts. It gives RI an appearance like it’s flash based or something like that. Why not use css and regular fonts instead of trying to smooth everything over?
If these things get tightened up and a few more features are added in before launch, RI could very well fit right in with Google Analytics and Mint. We’ll see what the future holds for RI very soon.
